Market Snapshot: October 2024
In summary
Markets predicted US election
- As the US election approached it appeared the Trump Trade was influencing markets most and turned out to be a decent election predictor.
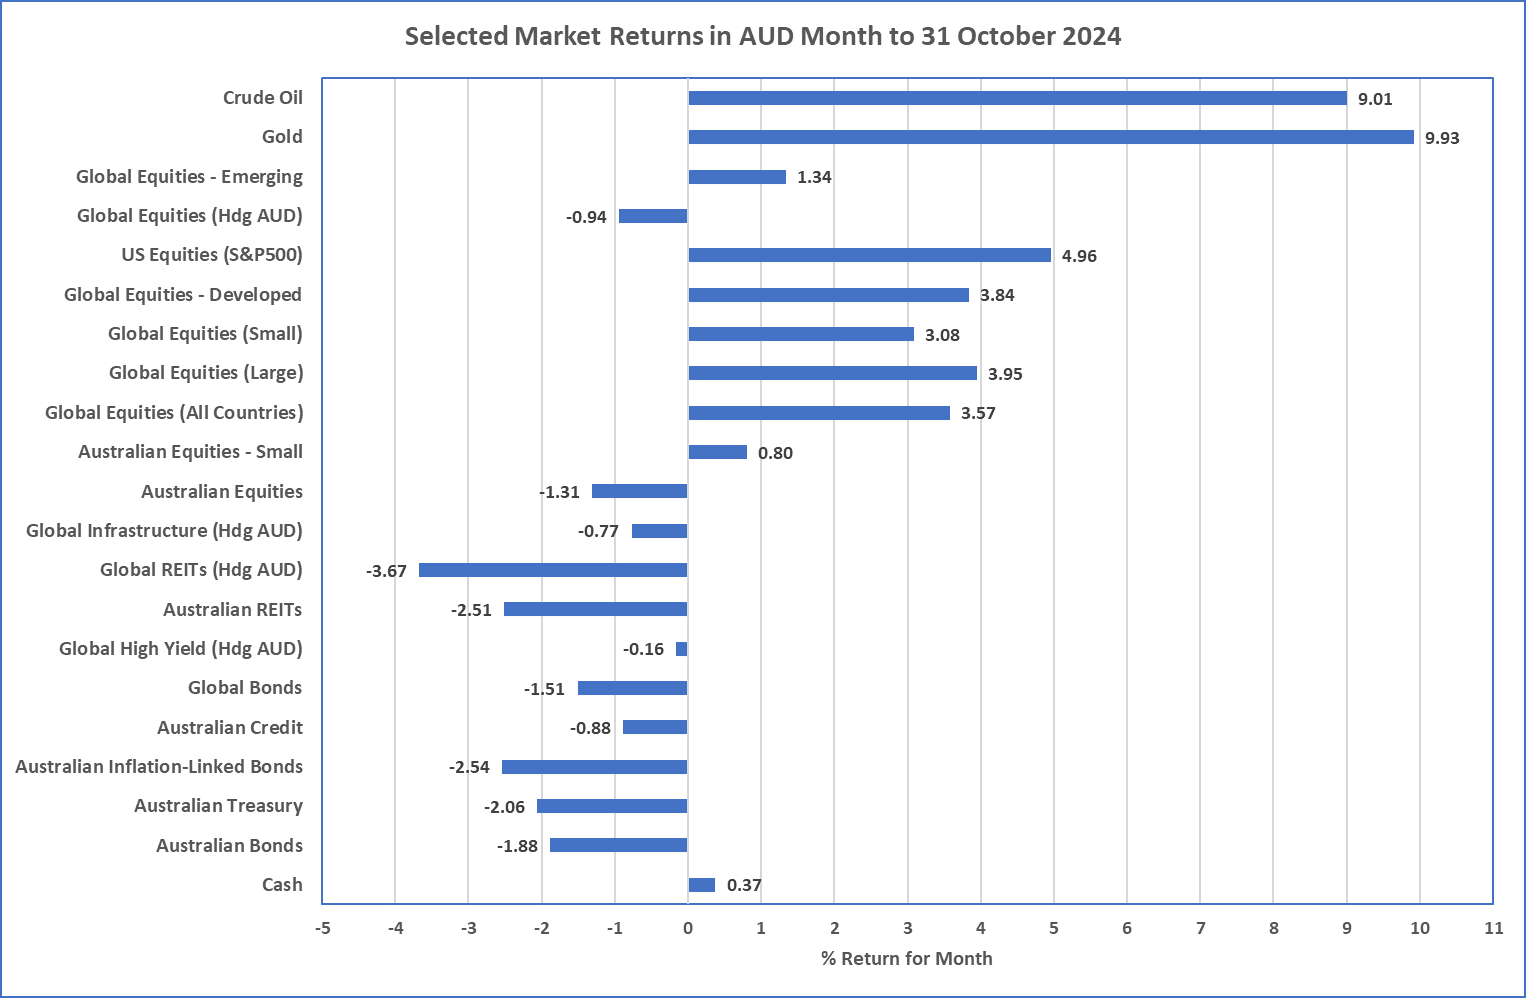
- Due to Trump’s proposed corporate tax cuts and tariff induced deficits, the Trump trade translates to a positive for equities and negative for bonds … and that’s how markets ended the month of October. The best performing sharemarket was the USA, and higher bond yields also led to weaker real asset prices (i.e. property and infrastructure).
- Whilst inflation is low in the USA and Australia, it is mostly due to energy price deflation. Services inflation in both of these services economies remains above comfort levels (>4.5%). So low inflation shouldn’t be expected to be sustainable yet.
- Markets currently indicate that the Reserve Bank may not reduce rates until the second quarter of 2025 … with the earliest chance being February. Economic data will ultimately determine when.
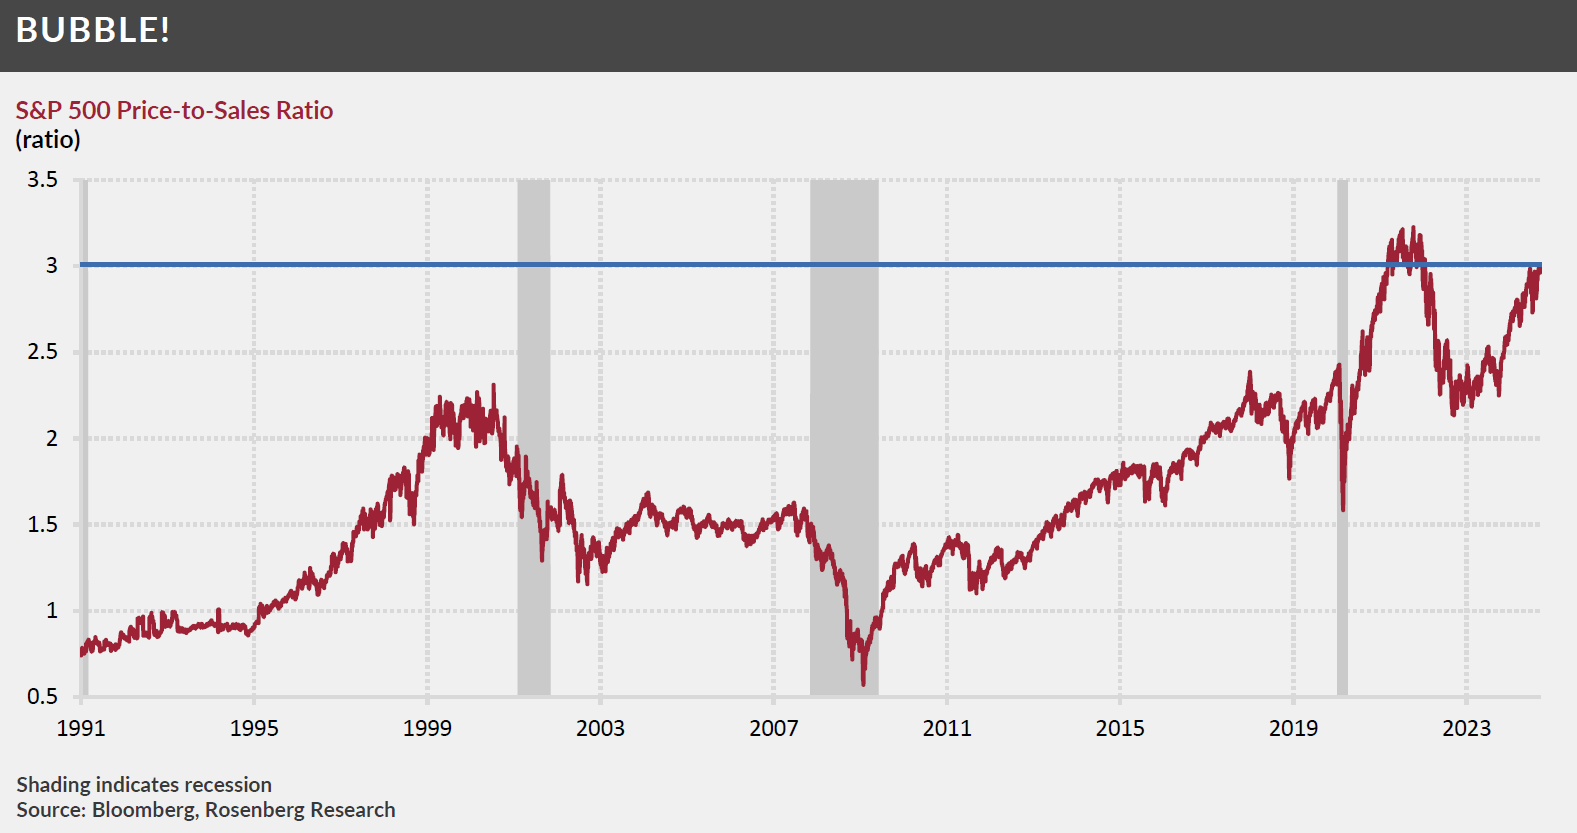
- We reiterate that the US sharemarket is expensive whether historically or compared to other markets, and the Chart on the bottom of page 4 shows how expensive the USA’s S&P500 really is.
- The core investment message remains the same and is do not chase the strong performer, maintain diversification, rebalance, and prepare for potential volatility as economies adjust to a potentially slightly new Trump-influenced world (although election promises rarely succeed).
Chart 1: Trump Trade is good for equities and not for Bonds

Source: Morningstar
What happened last month?
Markets & Economy
-
The month of October appeared very much focused on the US election as the policies of both candidates were likely to impact markets
differently. It turned out the Trump Trade was most influential as US sharemarkets went up the most whilst bond markets went down (i.e.
yields increased).
- Trump's friendly corporate tax cuts, amongst other benefits are US sharemarket friendly, whilst his high tariffs are likely to increase the fiscal deficits, hence higher bond yields or lower bond prices.
- The higher bond yields hurt the long duration assets of property and infrastructure, and their October returns were the weakest.
- Australian sharemarket performance is likely to be hurt by tariffs as well as those imposed on China, so with the benefit of hindsight it should be unsurprising to see the Australian sharemarket down in October too.
-
In terms of economic data, USA September quarter economic growth is a very strong 4.8%, headline inflation is a low 2.4%, and
unemployment is also low at 4.1%. Australia also has low headline inflation (2.8%) and unemployment (4.1%), but economic growth
has been weak in 2024, and the September quarter results are not due for a few weeks.
- What is important to note is that headline inflation is low because of energy. In the USA, energy inflation is -6.8% (that's negative), and in Australia, energy has also deflated as evidence by electricity inflation which is -15.8%.
- Services inflation remains inflated in both USA (4.7%), and Australia (4.5%) and this sticky component of overall inflation must reduce for lower inflation to be sustainable. Let's not forget both Australia and USA are predominantly services economies.
- The Reserve Bank has kept cash rates on hold, and, at the time of writing, markets are not pricing in a rate cut until the second quarter of 2025 (as opposed to the media agreed February rate cut).
Outlook
- The Trump Trade appears to be in full swing so there is currently positive momentum in sharemarkets which may continue over the short term. Momentum is a powerful force in financial markets.
- Bonds will likely be volatile as the current lower inflation trend competes with potentially higher deficits and a return of inflation from tariffs. Volatility of longer duration bonds appears most likely over the shorter term as clarity is sought around future economic policy.
- With sharemarkets running strongly again, we will likely hear more “bubble” talk as their valuations pass through levels that have not been seen too often. The US appears priced for very strong growth and company results must be broadly strong and growing to sustain current levels.
- At this point in time, it is impossible to know which of Trump’s promises, and particularly his tariffs, because they will generally require approval of Congress. That said, the President can impose tariffs on imports that pose a threat to national security (e.g. China), but it’s difficult to see if that applies to everyone and particularly countries like Canada and Australia.
- Diversification continues to be essential in this environment, whether shares, bonds, real assets, as well as across regions and broader asset class levels.
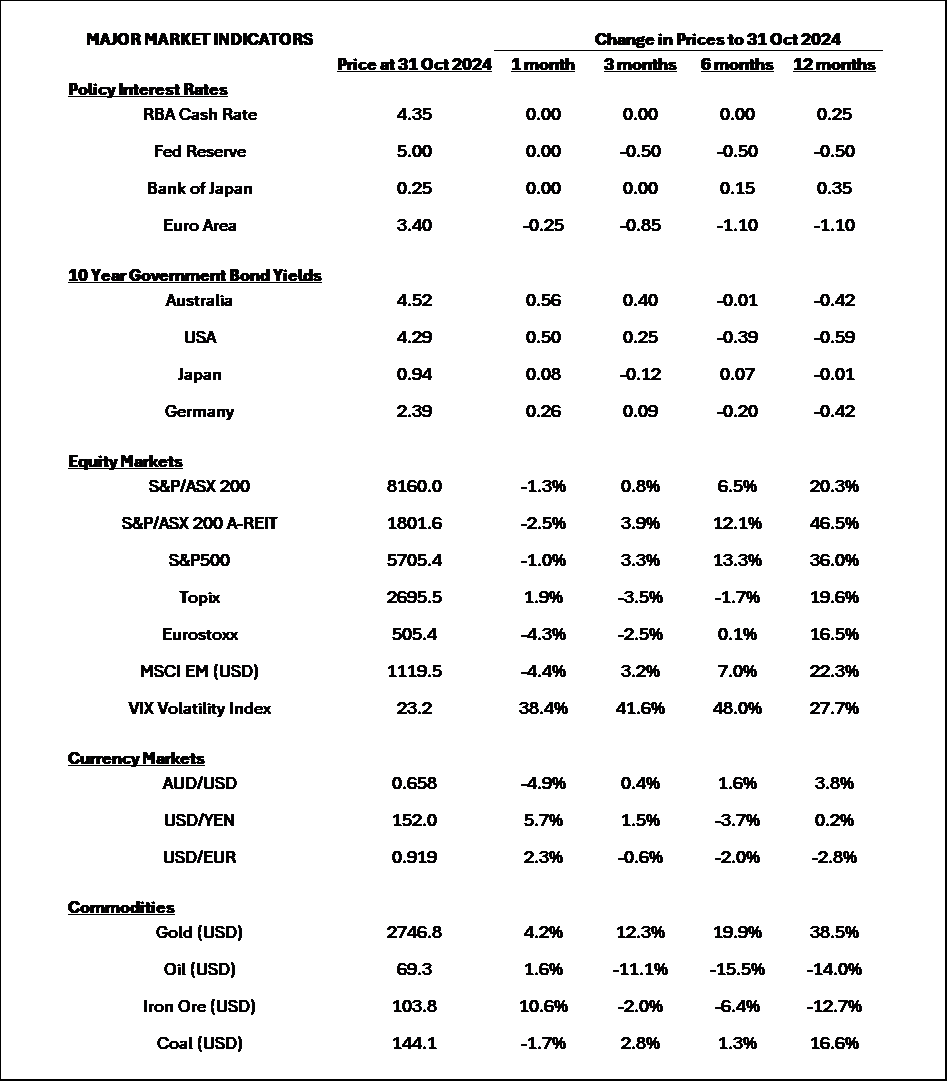
Major Market Indicators

Sources: Morningstar, Trading Economics, Reserve Bank of Australia
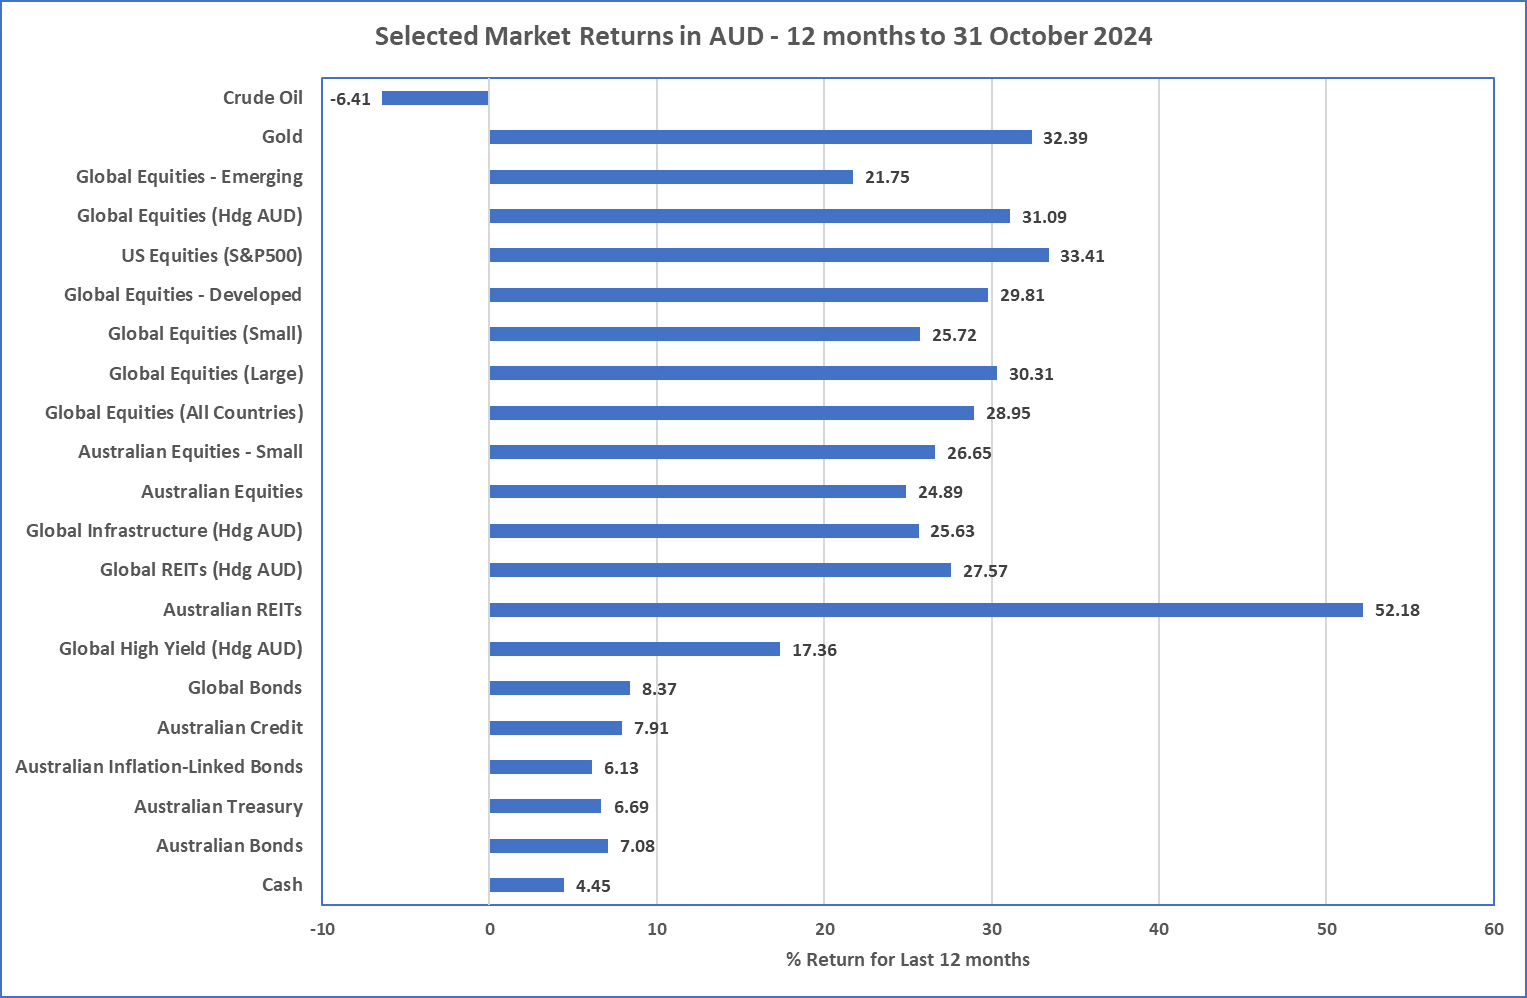
12 month Asset Class Returns

Source: Morningstar
Australian REITs with the best performance over 12 months to 31 October with an astonishing 25% return

McConachie Stedman Financial Planning Pty Ltd is a Corporate Authorised Representative of MCS Financial Planning Pty Ltd | ABN 11 677 710 600 | AFSL 560040

